Live Proof-of-Work mining data · updated Sep 28, 21:46 UTC

Most profitable ASIC miners for your watts

Ranked by Profit per Watt

Your rig has a power budget and every watt should earn the most money possible. Enter your power limit and electricity rate - CoinWarz returns the highest-profit Bitcoin, Zcash, and PoW hardware, ranked by net daily profit per watt from live network difficulty, hashrate, and prices.

W

Watts at the wall outlet, not the nameplate on the spec sheet. Real draw is usually higher.

$ /kWh
Algorithms none selected = all
Advanced options Fee, uptime, budget
%
%
$

Results update as you type, ranked by Profit per Watt.

Total daily net profit $74.52 ≈ $2,268.05/month · 7 machines
Watts used 2,990 W 10 W remaining
Profit per Watt $0.024921 per watt / day, whole mix

This mix earns $0.06 more per day than the best single machine (1 × Bitmain Antminer Z15 PRO 840Kh/s).

Rest of the mix. 1 more model fills the remaining watts.

  1. 2 Bitaxe GT 800 2.4Th/s Bitaxe · 2.40 TH/s · BTC Profit / watt$0.000281per day Net / day$0.06$0.01 each Quantity×6units Watts35 W210 W total Calculator Buy
Power breakdown 2,990 W of 3,000 W · 99.7% used
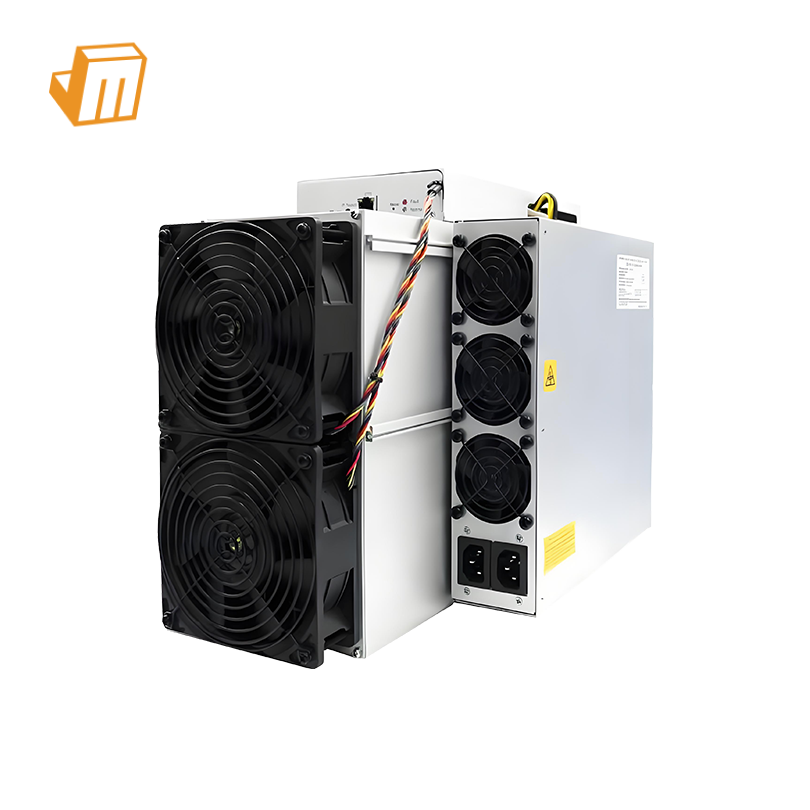
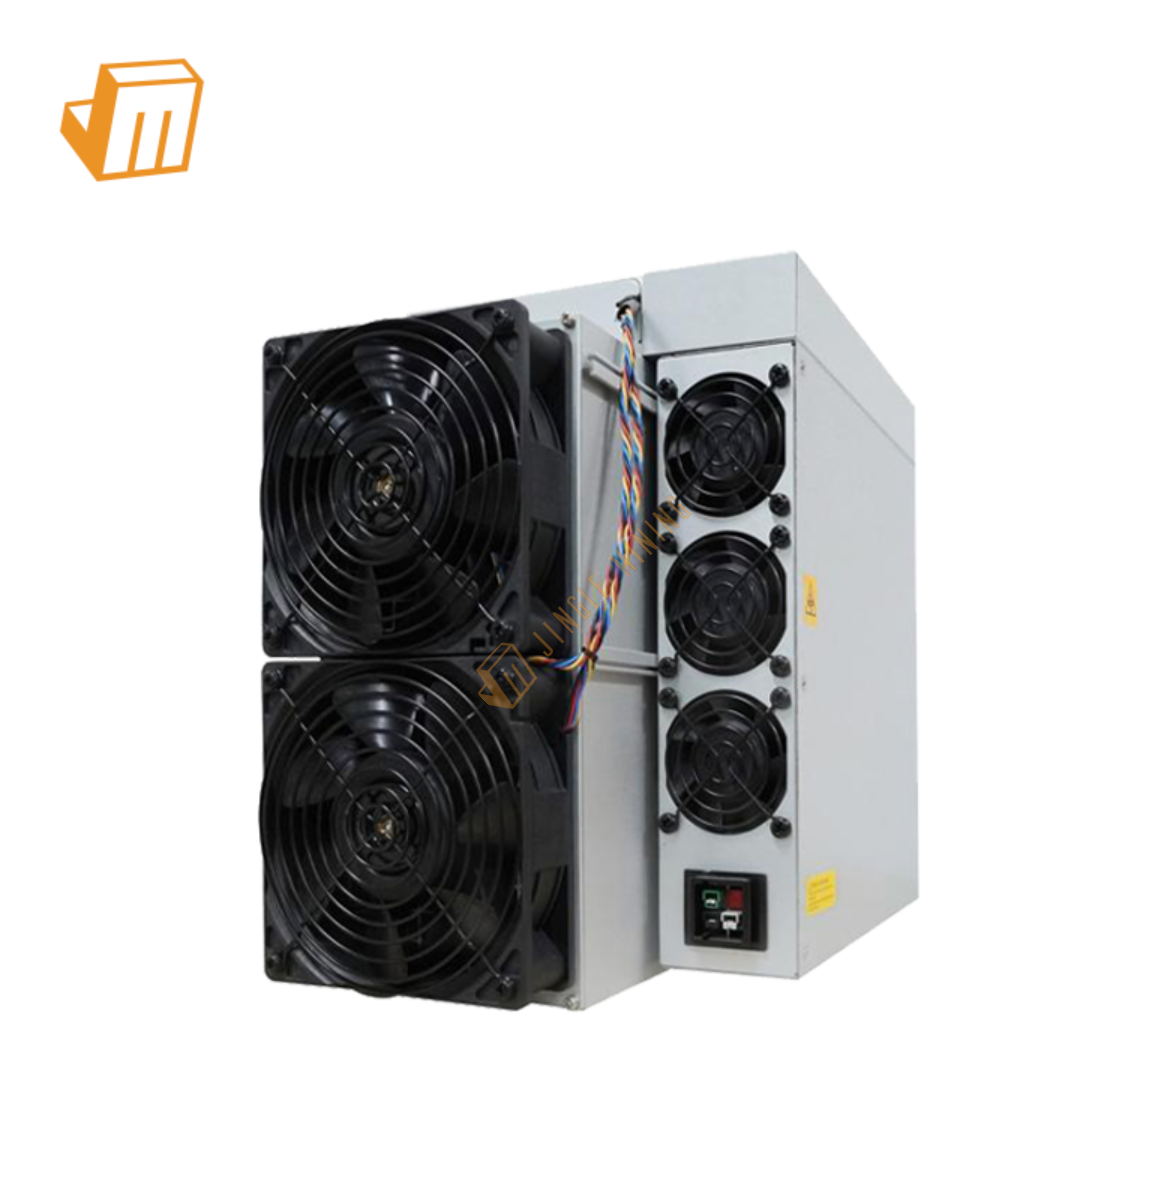
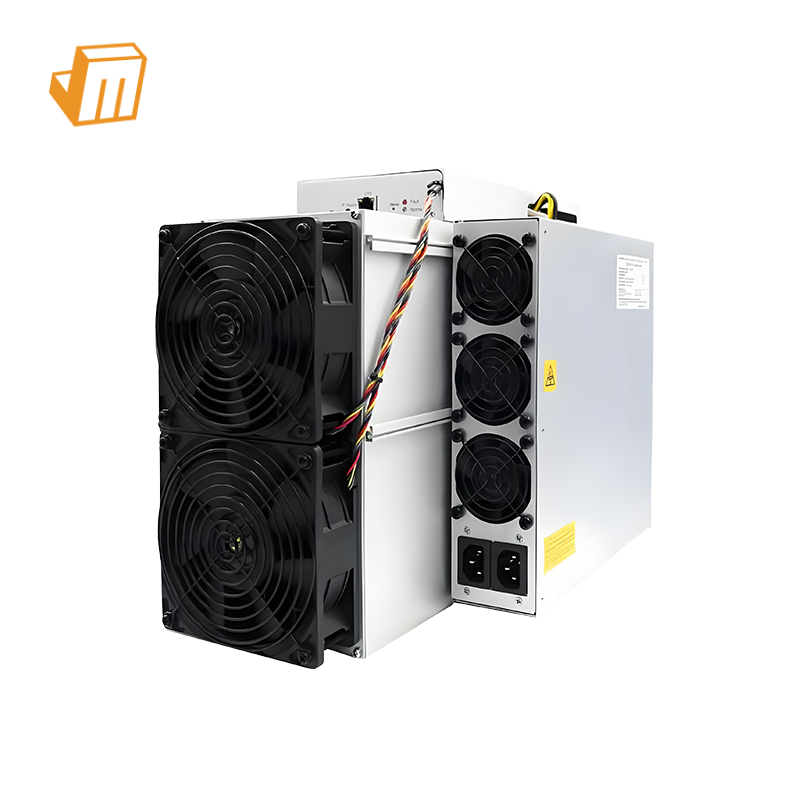
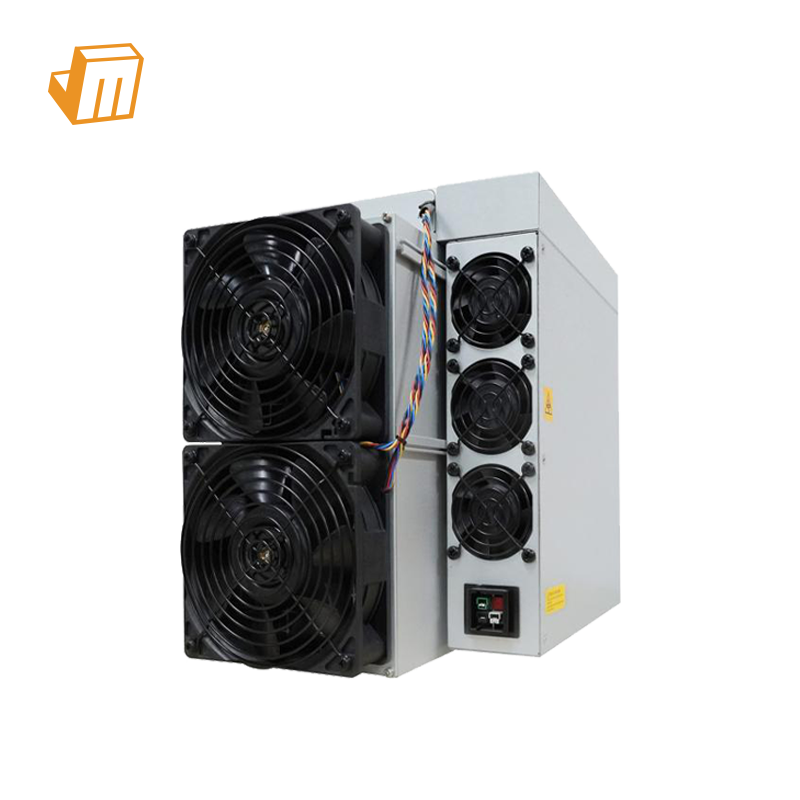
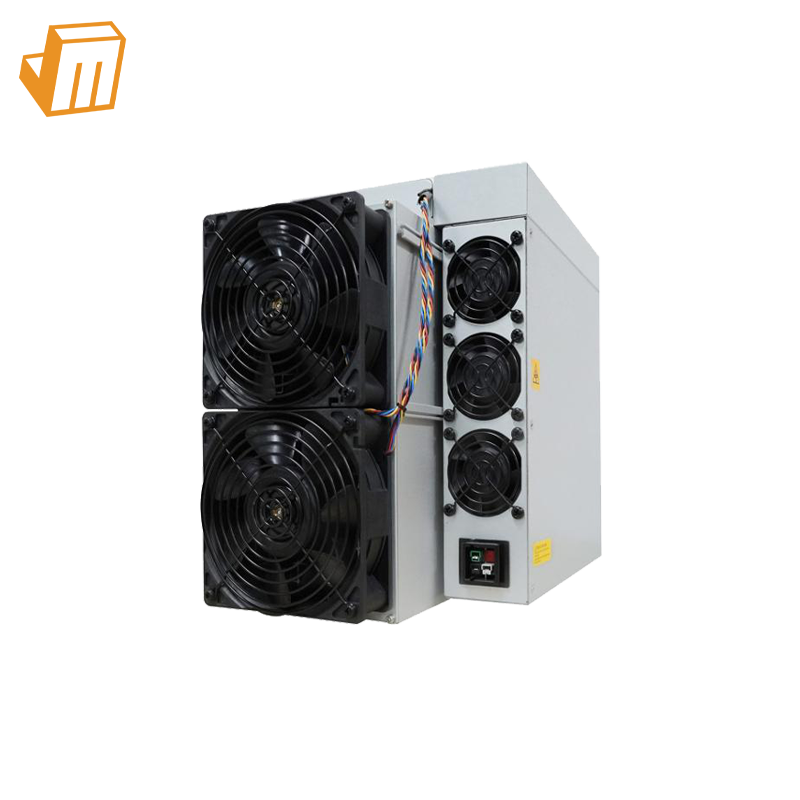
  • Bitmain Antminer Z15 PRO 840Kh/s ×1 2,780 W 92.7% of power $74.46 99.9% of profit
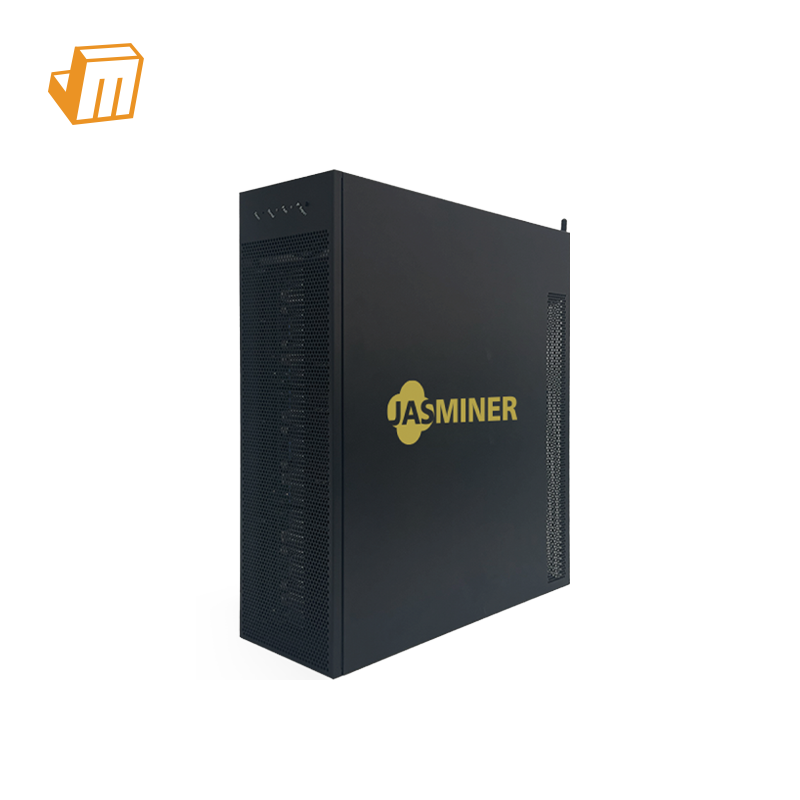
  • Bitaxe GT 800 2.4Th/s ×6 210 W 7% of power $0.06 <0.1% of profit
  • Unused headroom 10 W 0.3% of power $0.00 nothing profitable fits

Bitcoin mining tools

Live profitability, network charts, and a one-year scenario planner for difficulty and price.

New

Bitcoin mining profitability forecast

Play out the next year of mining. Adjust difficulty and BTC price across 26 difficulty retargets, see daily profit for your hashrate and power cost, and sum cumulative earnings - with the next halving applied when it falls in the window.

  • Start from live difficulty, price, and block subsidy
  • Model bull, bear, or custom difficulty and price paths
  • Same transparent profit math as the live calculator
Hardware rankings

Top miners by Profit per Watt

Ranked across every algorithm at $0.10/kWh electricity. Higher Profit per Watt means more money from the same power budget.

View all miner rankings
# Hardware Mines Power Profit / Watt Net / day
1 Bitmain Antminer Z15 PRO 840Kh/s Bitmain ZEC 2,780 W $0.026783/W $74.46
2 Bitmain Antminer Z15K Bitmain ZEC 2,483 W $0.018021/W $44.75
3 Bitmain Antminer Z15 420K Bitmain ZEC 2,780 W $0.012191/W $33.89
4 Antminer D9 1770Gh/s Bitmain DASH 2,839 W $0.007886/W $22.39
5 Antminer U3S23H 1160TH/s Bitmain BTC 11,020 W $0.001715/W $18.90

Explore CoinWarz

Mining calculators, price charts, difficulty charts, hashrate charts, mining hardware rankings, and guides for every supported PoW coin.

Live coin prices

Tap any coin to open its USD price chart and historical trends.

Why Profit per Watt wins

Power is the one resource every miner is capped on. Two machines can earn the same dollars per day - the efficient one does it on far fewer watts, leaving headroom to add rigs, survive price dips, and stay profitable when electricity costs rise.

Miner A Less efficient
Net profit $6.00 / day
Power draw
3,000 W
Profit per Watt $0.002000/W·day
Relative efficiency 50%
Miner B Efficient
Net profit $6.00 / day
Power draw
1,500 W
Profit per Watt $0.004000/W·day
Relative efficiency 100%
2× Profit per Watt

Same daily profit, half the power. Miner B lets you run twice the hashrate on the same circuit - that's why CoinWarz ranks by Profit per Watt instead of raw hashrate or sticker profit.

Browse miners by Profit per Watt →

Proof of Work Cryptocurrencies

Algorithm, block reward, target block time, and live price for each supported coin.

Algorithm, block reward, block time, and price for each supported coin
Coin Algorithm Block reward Block time Price (USD) Tools
BTC Bitcoin Sha256 3.125 BTC 600 s $83,392
Tools
ZEC Zcash Equihash 1.5625 ZEC 75 s $1,461
Tools
XMR Monero RandomX 0.6 XMR 120 s $538.37
Tools
LTC Litecoin Scrypt 6.25 LTC 150 s $69.23
Tools
DOGE Dogecoin Scrypt 10,000 DOGE 60 s $0.0934
Tools
DASH Dash X11 1.55 DASH 157 s $64.26
Tools
ETC Ethereum Classic Ethash 2.56 ETC 13 s $9.21
Tools
BCH Bitcoin Cash Sha256 3.125 BCH 600 s $307.77
Tools
RVN Ravencoin KawPow 2,500 RVN 60 s $0.002268
Tools
ALPH Alephium Blake3 3.06 ALPH 8 s $0.0605
Tools
ETHW EthereumPoW Ethash 2 ETHW 13 s $0.2827
Tools
VTC Vertcoin Verthash 12.5 VTC 150 s $0.0408
Tools
BELLS Bellscoin Scrypt 2 BELLS 60 s $0.0287
Tools
SYS Syscoin Sha256 60 SYS 60 s $0.002691
Tools

How CoinWarz calculates mining profit

  1. 1 Hash share

    Your miner hashrate divided by the live network hashrate from full nodes or block explorers.

  2. 2 Daily coins

    Block reward × (86,400 ÷ block time) × hash share. Merge-mined Scrypt (LTC + DOGE) sums both chains' rewards.

  3. 3 Revenue

    Daily coins × USD price (refreshed every 10 minutes).

  4. 4 Costs

    Power cost = (watts ÷ 1000) × 24 × your USD/kWh rate. Pool fees = revenue × pool fee.

  5. 5 Profit per Watt

    (Revenue − power cost − pool fees) ÷ watts - the headline metric used to rank all hardware.

News and Learn

Latest mining news

All news →
CryptoSlate

Strategy makes first back-to-back Bitcoin buys since June as accumulation picks up

Michael Saylor-led Strategy (formerly MicroStrategy) has made back-to-back weekly Bitcoin purchases for the first time since June, rebuilding its holdings after selling some of the cryptocurrency earlier this quarter. On Sept. 28, the company said it acquired 1,665 Bitcoin for $142.7 million during the week ended Sept. 27, paying an average of $85,681 per token. That followed […] The post Strategy makes first back-to-back Bitcoin buys since June as accumulation picks up appeared first on CryptoSlate .

News BTC

PrimeXBT Insights: Bitcoin rallied through a rate hike; Can it rally through a bond selloff?

By Jonatan Randin, Senior Market Analyst at PrimeXBT In mid September the setup looked bad for Bitcoin. The CLARITY Act failed in the Senate on 15 September and the Fed hiked to 3.75 to 4.00% the next day. Bitcoin (BTC) briefly traded under $75,000. A week later it was above $87,000. Then the bond market moved, and Bitcoin stopped going up. What happened in bonds On 23 September the 10 year US Treasury yield jumped more than 18 basis points, the biggest one day rise since April 2025. It kept going and rose above 5.2% the next day, the highest since 2007. The 30 year reached about 5.50%, a level last seen in 2004. There was no single trigger. Strong PMI data, a weak five year auction and higher oil all played a part. The Treasury even bought back $4 billion of long bonds on 24 September, and yields still rose. Why the hike didn’t matter much Everyone saw it coming. By the eve of the meeting, futures markets priced the hike at close to 90%. Some of Bitcoin’s weakness in the weeks before arguably reflected that repricing. ETF flows show it. Spot Bitcoin ETFs lost about $750 million over 15 and 16 September, then took in $2.39 billion in the week to 25 September, their biggest week since October 2025 according to Farside Investors. Why the bond move is different Look at those flows day by day: $999 million on Monday, then $715 million, $347 million, $191 million and $135 million on Friday. The buying never stopped. It just got smaller as yields went up. A hike is one decision with a known size. A bond selloff has no size, and the market decides how far it goes. Yields above 5% compete directly with an asset that pays nothing. There’s another way to read it. If the Treasury has to keep borrowing at higher rates, the deficit grows and so does the supply of bonds. Many in crypto see that as the long term case for Bitcoin. For now, though, the short term effect is the one showing up in the flows. So far Bitcoin is holding the move. It isn’t extending it. What the chart says On the 3 day chart, Bitcoin broke above the $70,000 region around 20 August. It then spent a few weeks consolidating near $80,000 before breaking higher again last week. That second breakout matters. It’s arguably the first higher high on the higher timeframes since the bear market began, and price reached above $87,000 before pulling back. Bitcoin (BTC/USD) 3 day chart with the 20 and 50 EMA. The breakout above $80,000 marks the first higher high since the bear market began, and the 20 EMA has crossed above the 50 EMA. Source: TradingView The moving averages support the same picture. The 20 EMA has crossed above the 50 EMA on the 3 day chart for the first time since they crossed down in November 2025, which is roughly where the bear market started. Price is now retracing the latest leg up. The next higher timeframe support sits at $80,000, and the 50% Fibonacci retracement of the move from around $75,000 to $87,000 falls just above it, near $81,000. As long as Bitcoin holds the $80,000 area, the overall structure could still be read as constructive. A sustained move back below it would put that higher high into question. Navigating Bitcoin’s next move with PrimeXBT As Bitcoin’s recovery meets pressure from rising bond yields, PrimeXBT, a global multi-asset broker and crypto asset service provider, allows traders to position for either a continuation of the rally or a deeper pullback. Clients can trade BTC through Crypto Futures and CFDs, taking long or short positions with adjustable leverage, as well as buy, exchange and hold Bitcoin and other cryptocurrencies. Crypto Futures maker fees are 0.01% and taker fees start from 0.045%, falling to 0.015% at VIP 5 tier through PrimeXBT’s volume-based VIP program. Crypto CFDs carry no trading commission, with BTC/USD spreads available as low as $19 at the same tier.  The same forces testing Bitcoin’s recovery are also relevant to Gold, US Dollar pairs and major equity indices. PrimeXBT provides access to these markets off

Bitcoin Magazine

Belarus Approves the Country’s First Crypto Banks: Report

Bitcoin Magazine Belarus Approves the Country’s First Crypto Banks: Report  Belarus earlier this year signed a legal framework for crypto banks in the country. This post Belarus Approves the Country’s First Crypto Banks: Report  first appeared on Bitcoin Magazine and is written by Mathew Di Salvo .

Bitcoin Magazine

UK Chancellor of the Exchequer Blasts Nigel Farage’s ‘Bitcoin Account’

Bitcoin Magazine UK Chancellor of the Exchequer Blasts Nigel Farage’s ‘Bitcoin Account’  The UK’s finance minister has criticized the pro-Bitcoin leader of Reform UK. This post UK Chancellor of the Exchequer Blasts Nigel Farage’s ‘Bitcoin Account’  first appeared on Bitcoin Magazine and is written by Mathew Di Salvo .

Learn & guides

All articles →

What Is Bitcoin Mining Difficulty: How the system self-corrects

Mining difficulty is Bitcoin's automatic adjustment mechanism that keeps block times stable. At 126.23T as of August 2026, it determines how hard it is to mine each block. Here is exactly how the system recalibrates every two weeks.

CoinWarz

Frequently asked questions

Direct answers to common mining questions - updated with live data when available.

What is CoinWarz?

CoinWarz is a Proof-of-Work (PoW) mining profitability platform. It provides live mining calculators, network difficulty and hashrate charts, USD price history, and ASIC hardware rankings sorted by Profit per Watt - net daily mining profit divided by power draw in watts.

How do you calculate crypto mining profitability?

CoinWarz estimates daily mining profit as: (your hashrate ÷ network hashrate) × block reward × blocks per day × coin USD price − electricity cost − pool fees. Blocks per day = 86,400 ÷ target block time in seconds. Electricity cost = (watts ÷ 1000) × 24 × USD per kWh. Pool fees = gross revenue × pool fee rate.

What is the current Bitcoin price and network stats?

Bitcoin (BTC) is $83,392 USD on CoinWarz (updated Sep 28, 21:42 UTC). The SHA-256 network difficulty is 132.76T with an estimated hashrate of 1.11 ZH/s. The current block subsidy is 3.125 BTC per block (~10 minute target block time).

What is Profit per Watt in mining?

Profit per Watt is net daily mining profit in USD divided by miner power draw in watts (USD/W/day). CoinWarz uses it as the headline metric for hardware rankings because electricity is the largest ongoing cost and efficiency determines real-world returns more than raw hashrate alone.

Which cryptocurrencies does CoinWarz support?

CoinWarz tracks 14 active PoW coins: Bitcoin (BTC), Zcash (ZEC), Monero (XMR), Litecoin (LTC), Dogecoin (DOGE), Dash (DASH), Ethereum Classic (ETC), Bitcoin Cash (BCH), Ravencoin (RVN), Alephium (ALPH), EthereumPoW (ETHW), Vertcoin (VTC), Bellscoin (BELLS), Syscoin (SYS). Each has a mining calculator, optional difficulty/hashrate/price charts, and algorithm-matched hardware rankings.

Where does CoinWarz get cryptocurrency prices?

USD prices are fetched from the CoinGecko public API every 10 minutes and stored in the CoinWarz database.

Where does CoinWarz get network difficulty and hashrate?

Block difficulty and estimated network hashrate come from synced full-node RPC data (Bitcoin, Litecoin, Dogecoin) or trusted block explorers (Zcash via Blockchair, Monero via LocalMonero). Values are recorded per block and shown on charts and calculators.

Does CoinWarz support Litecoin and Dogecoin merge mining?

Yes. Litecoin and Dogecoin are AuxPoW merge-mined on the Scrypt algorithm. One Litecoin hashrate share earns both LTC (≈6.25 LTC/block, 150s target) and DOGE (≈10,000 DOGE/block, 60s target) block rewards against the Litecoin network hashrate.

Which ASIC miner is most profitable?

The most profitable miner depends on your electricity rate, coin price, and network difficulty. CoinWarz ranks all listed hardware by Profit per Watt at your USD/kWh - use the Miners page to compare ASICs across algorithms or filter by coin.